Translate

Guide to Patagonia's Monsters & Mysterious beings

I have written a book on this intriguing subject which has just been published.
In this blog I will post excerpts and other interesting texts on this fascinating subject.

Austin Whittall


Showing posts with label allele. Show all posts

Thursday, September 29, 2016

Heterozygosity for dummies


Heterozygosity is lower in all non-Africans when compared to Africans.


What does this mean?


First of all what is Hetrerozygosity?


Heterozygosity

We all have two copies of each gene. That is because we got half of our chromosomes (with their respective genes) from each of our parents), making one copy from each of them.


Genes come in different variants, known as alleles.


So if there are two possible alleles: "b" and "B" (one per gene) you may have any of the following combinations arising from the mixing of your parent's genes

  • bb
  • bB
  • Bb
  • BB

That is four options, two in which each gene has the same allele (bb, BB) and therefore you are Homozygous and two in which you have different alleles (bB, Bb) which makes you Heterozygous.


It is evident that homozygosity implies less genetic variability (being BB you lack the "b" allele or if you are bb, you will lack the "B" allele). And this may have consequences regarding your health and surviveability.


Populations.

We must also take into account that the proportion of "b" and "B" in can be different, in other words they are present at different frequencies: "p" and "q" respectively which are not necessarily the same.


In other words the frequency of each genotype (bb, Bb, or BB) in a given population (known as "allele frequency") will depend on the frequencies of each allele:


In a very large (infinte) population where individuals mate at random, we can calculate the allele frequency using the Hardy-Weinberg Theorem using this formula to calculate the frequencies (f) of each of the three genotypes (bb, BB, Bb):

  • f(bb) = p2
  • f(bB) = 2pq
  • f(BB) = q2

And since they are "all" the genotypes, their sum must add up to 100% of the populaton:


100% = p2 + 2(pq) +q2


Say b is present at p = 30% and B has a frequency of q= 70% (both frequencies must aldo add up to 100%), then:


100% = (30%)2 + 2(30% x 70%) + 70%2


100% = 9% + 42% + 49%


So the frequency of bb alleles is only 9% meaning that 9% of the population is homozygous for b. 42% is heterozygous and 49% is homozygous for B.


But in a real world, humans don't mate randomly: they choose partners for different reasons, or, due to cultural rules may marry within their group (endogamy).


Also some homozygous alleles may cause genetic diseases such as cystic fibrosis, Tay-Sachs or phenylketonuria which may kill individuals before they become adults and reproduce, here selection is actively working to modify zygosity.


As populations are not infinte but finite, there is not an endless genetic pool, but a discrete one so in smaller or isolated populations, heterozygosity will fall due to random events (imagine adults that have no offspring, eliminating their alleles from the genetic pool).


The opposite effect is when two isolated populations admix, adding new alleles to the gene pool, increasing heterozygosity.


So, the factors that provoke homozygosity are:

  • Inbreeding
  • Geographic isolation
  • Genetic Drift
  • Cultural practices -i.e. consanguineous marriage or endogamy
  • Positive evolutionary selection

It can fall, on the other hand if there is an isolation-breaking event such as the mixing of two previously isolated populations.


Let's take a look at each of these factors:


1. Interbreeding

The taboos that forbid marrying your next of kin have a genetic basis: those closely related to you will carry many genes identical to yours. Since relatives share alleles, inbreeding will bring together identical copies of an allele more frequently than breeding between unrelated mates, and this increases homozygosity:


"F", the Inbreeding coefficient is the probability that two alleles are identical copies of an allele from a common ancestor. It is also, the proportion of the population that is inbred (having two alleles identical by descent).

We can take the expression used above and adapt it to calculate the frequencies of alleles in an inbred population:


  • f(bb) = p2+2Fpq
  • f(bB) = 2pq (1-F)
  • f(BB) = q2+Fpq

All must add up to 100% of the population.


So if inbreeding coefficient is 20%, the relative frequencies of bb, BB and Bb would be (we will use the same frequencies as in the original example: b is present at p = 30% and B has a frequency of q= 70%):


100% = (30%)2 +2 x 20% x 30% x 70% + 2(30% x 70%)(1-20%) + 70%2 +2 x 20% x 30% x 70%


100% = 13,2% + 33,6% + 53,3%


So the comparison is:


  • bb increases from 9% to 13.2% of the population
  • BB increases from 49% to 53.3% of the population
  • Bb falls from 42% to 33.6% of the individuals

Heterozygosity drops due to inbreeding even though the same alleles are present.


Since some genetic traits are recessive, and manifest themselves only when the two alleles are present, that is, homozygosity for those alleles is present, inbreeding increases the frequency of these recessive traits, which could be as benign as blue vs. dark eyes or nasty as congenital diseases.


Genetic drift

Imagine a population which starts off with p = q = 50%. In other words, the proportion of B and b is identical. Applying Hardy-Weinberg Theorem we can calculate the genotype frequencies:


100% = (50%)2 + 2(50% x 50%) + 50%2


100% = 25% + 50% + 25%


So50% are heterozygous (Bb) while the other half is equally homozygous: 25% are BB and 25% are bb.


But this is in an infinte population and also, the frequencies p and q are probabilities.


Real life may reflect these probabilities in a different way. Look at it this way: when you flip a fair coin there is an equal chance (p=50%) of getting heads and or tails (q=50%). But in practice we all know that you could throw 3 heads in a row and get only 2 tails in a series of five tosses. Which is not a 50 ⁄ 50 proportion. it is 66% ⁄ 40%. You may even get 3 heads in a row in a series of 3 tosses (100 ⁄ 0).


So in small series it is unlikely that the actual real frequency is close to the theoretical probability (p or q).


However, when you use larger series, for instance if you tossed the coin 1,000 times, the ratio would be closer to 50 ⁄ 50 (say 494 tails and 506 heads).


This same effect applies to the probability frequencies in small populations: two heterozygous parents (bB) could have all four offspring that are homozygous (bb) just by chance.


So, in small populations this phenomenon known as "Genetic drift" just by random forces -not by natural selection or deliberate interbreeding- can change the frequency of some alleles in very short time, making them extremely common ("Fixing them") or making them disappear.


Founder Effect

Founder events take place when a small sub-population of a larger one migrates and establishes a new settlement (hence "founder" population). It is obvious that not all the alleles present in the original population will be present in this smaller group. Those left behind will not appear in the new one, this reduces the total quantity or "allele richness" of the new subpopulation.

Liken it to randomly taking 4 M&M's from a bag holding 500 candies, it is probable that you will not pick all the available colors. So if the M&Ms in the bag are red, yellow, green, blue and brown in equal proportions, you could very well have picked: 2 yellow, 1 green, 1 red and no brown or blue candies. So this does in effect reduce the "diversity" or "richness" in the subpopulation but, it may not impact on heterozygosity:


Imagine the population we mentioned befor where 9% were homozygous for b (bb), 42% were heterozygous (Bb) and 49% were homozygous for B (BB). Now lets imagine that a small group from this original one forms a colony elsewhere, and just by chance, 60% of the individuals carry the Bb heterozygosity, while the remaining 40% are BB homozygous.


This new subpopulation will therefore have a higher heterozygosity than the original population (60% vs. 49%), but it will surely be less rich or diverse due to the alleles left behind (M&M analogy).


Founder effect impacts on the "allelic richness" by reducing it but it may no have much effect on hetrerozygosity. This is because the richness is based on the presence of the alleles and not on the internal diversity within them. A rare allele lost during a founder effect reduces the diversity but will probably have little impact on heterozygosity.


Bottleneck

This is a drastic reduction in a population. It could be caused by disease or a natural catastrophe (drought, volcanic eruption, fire, Ice Age, global warming).


Those that survive will carry only part of the genetic diversity of the original population, as those lineages that perished, are gone forever. But this does not mean that heterozygosity drops. Actually, allelic richness falls faster than heterozygosity because bottlenecks usually wipe out ,any low-frequency alleles and this causes an excess of heterozygosity in selectively neutral loci compared to normal populations subjected to genetic drift.


Leberg (1992) investigated loss of heterozygosity and allelic variation experimenting with mosquitofish and found that a decrease in heterozygosity only happens when the bottleneck is extreme and prolonged.


Selection

After the population reduction in founder effects or Bottlenecks & Geographic Isolation (which may also lead to inbreeding due to the smaller population), diversity will increase again due to chance mutations.


Another factor that may modify the genetic patterns is Natural Selection: the bottleneck may have caused the fittest to survive -imagine a disease that those equipped with some genetic advantage manage to survive while the others perish- and therefore selection increases the frequency of certain genes in the new population, when compared to the pre-bottleneck one.


Geographic Isolation

Similar to Bottlenecks, it is the separation of one group from the main population, as when there is a founder event.


Heterozygosity and Human Evolution

So when defenders of the "Out of Africa" theory use heterozygosity to support an African origin for Mankind, they point out that Africans have the highest heterozygosity of all human populations: the others (non-Africans) have lost it as they migrated out of Africa in small bands (founder effect), separated widely (geographic isolation), were more prone to fall prey to natural catastrophe (bottle necks), inbred more frequently as they were smaller populations and in doing so lost heterozygosity which the original basal population in Africa retained.


An example of this is shown in the image below which charts "heterozygosity vs. distance from Africa (Addis Ababa)" (from [1]):


This chart from [5] show more or less the same information:


Allelic Diversity

Having said this, we must point out that "Genetic Diversity" is not only measured by heterozygosity but also by the "number of alleles" present in a given population, that is "allele richness" or "allelic diversity" which is calculated as the average number of alleles per locus.


In other words a population may have a high heterozygosity compared to another and supposedly be "more diverse" but, overall have a lower number of alleles which makes it definitively "less diverse".


An example of this paradox is shown in this paper (Begoña Martínez-Cruz et al., In the heartland of Eurasia: the multilocus genetic landscape of Central Asian populations [1]) which has interesting data in its Table 2 which shows the "Average AR" - allelic richness- and "expected heterozygosity He" for each of the 26 Central Asian populations and other nearby regions:


AR He   Population
12.66 0.819 Central/South Asia
 8.60 0.820 Central Asia - TJK
 8.50 0.812 Central Asia - TJT
 8.50 0.774 Central Asia - UZB


The first two have the same He (heterozygosity) of around 0.82 but notably different allelic diversity (12.66 vs 8.60). The last two have the same allelic diversity (8.5) but different He (0.812 vs. 0.774).


Populations can have a richer genome despite having a lower heterozygosity, of course they could have mutated faster than another population and therefore increased the diversity in their genome adding new variants.


Does this mean higher heterozygosity in Africa mean that it is the cradle of humanity?


It means that heterozygosity is higher there. Just look at the archaic hominins, Neanderthals and Denisovans. Their heterozygosity is far lower than that of any extant human group, but we know that they predate Homo sapiens by several hundreds of thousands of years. They are less heterozygous but older and ancestral:


Prüfer et al. paper on Neanderthals [3] confirms this (highlighted in bold):


"The Neanderthal autosomal genome carries 1.7–1.8 heterozygous sites per 10,000?bp (Supplementary Information section 9). This is 84% of the number of heterozygous sites in the Denisovan genome, 22–30% of that in present-day non-African genomes, and 16–18% of that in present-day African genomes (Extended Data Fig. 1). When regions of homozygosity longer than 2.5?cM stemming from recent as well as long-term inbreeding in the Neanderthal are removed, 2.1–2.2 sites per 10,000 are heterozygous, similar to what is observed in the Denisovan genome. Thus, heterozygosity in Neanderthals as well as Denisovans appears to have been lower than in present-day humans and is among the lowest measured for any organism" [3]


Another paper by Meyer et al. on Denisovans [4] found the same diminshed heterozygosity:

"Denisovan genetic diversity. The high quality of the Denisovan genome allowed us to measure its heterozygosity, i.e., the fraction of nucleotide sites that are different between a person's maternal and paternal genomes (Fig. 5A). Several methods indicate that the Denisovan heterozygosity is about 0.022%. This is ~20% of the heterozygosity seen in the Africans, ~26 to 33% of that in the Eurasians, and 36% of that in the Karitiana, a South American population with extremely low heterozygosity. Because we find no evidence for unusually long stretches of homozygosity in the Denisovan genome, this is not due to inbreeding among the immediate ancestors of the Denisovan individual. We thus conclude that the genetic diversity of the population to which the Denisovan individual belonged was very low compared with that of present-day humans." [4]


This leads me to ask, what if African heterozygosity was enriched by recent admixture with other hominins in Africa? an inflow of different relic alleles elevated African diversity above that of non-Africans. Could current lower Amerindian heterozygosity reflect an ancient population just like that of Denisovans or Neanderthals?


We will look into these questions in my next post when we go over some recent papers on the possibility of an ancient Out of Africa event whose genes ended up in contemporary Papuans and Australians.


Sources


[1] Begoña Martínez-Cruz, Renaud Vitalis, Laure Ségurel, Frédéric Austerlitz, Myriam Georges, Sylvain Théry, Lluis Quintana-Murci, Tatyana Hegay, Almaz Aldashev, Firuza Nasyrova and Evelyne Heyer, In the heartland of Eurasia: the multilocus genetic landscape of Central Asian populations, European Journal of Human Genetics (2011) 19, 216–223; doi:10.1038/ejhg.2010.153; published online 8 September 2010.
[2] Paul Verdu, Trevor J. Pemberton, Romain Laurent, Brian M. Kemp, Angelica Gonzalez-Oliver, Clara Gorodezky, Cris E. Hughes, Milena R. Shattuck, Barbara Petzelt, Joycelynn Mitchell, Harold Harry, Theresa William, Rosita Worl, Ripan S. Malhi Patterns of Admixture and Population Structure in Native Populations of Northwest North America, PLOS Published: August 14, 2014 http://dx.doi.org/10.1371/journal.pgen.1004530
[3] Kay Prüfer, Fernando Racimo, Nick Patterson, Flora Jay, Sriram Sankararaman, Susanna Sawyer, Anja Heinze, Gabriel Renaud, Peter H. Sudmant, Cesare de Filippo, Heng Li, Swapan Mallick, Michael Dannemann, Qiaomei Fu, Martin Kircher, Martin Kuhlwilm, Michael Lachmann, Matthias Meyer, Matthias Ongyerth, Michael Siebauer, Christoph Theunert, Arti Tandon, Priya Moorjani, Joseph Pickrell, James C. Mullikin et al., The complete genome sequence of a Neanderthal from the Altai Mountains, Nature 505, 43–49 (02 January 2014) doi:10.1038/nature12886
[4] Matthias Meyer et al. A High-Coverage Genome Sequence from an Archaic Denisovan Individual, www.sciencemag.org SCIENCE VOL 338 12 Oct 2012
[5] Keith Hunley, Claire Bowern, Meghan Healy, Rejection of a serial founder effects model of genetic and linguistic coevolution, Published 1 February 2012.DOI: 10.1098/rspb.2011.2296


Patagonian Monsters - Cryptozoology, Myths & legends in Patagonia Copyright 2009-2014 by Austin Whittall © 

Friday, May 16, 2014

Out of America (into Asia)? Part 1


A paper (Morten Rasmussen et al., 2009) [1] reports the sequencing of the genome of a male from Greenland; it was obtained froma a hair (about 4,000 years old) that was found in the permafrost. The man belonged to a wave that peopled the New World long after the original and older migration of modern Amerindians.


The interesting part (from my perspective) is the information regarding Native Americans and how different they are from their purported Siberian ancestors.


The following image (Adapted from Fig. 3 in [1]) and, just by looking at it you can see some intriguing trends:


figure
Figure 3. From [1]

Part (b) of the figure (upper right corner of the image) shows a clear distribution where Siberians and East Asians are found on the upper branch, Europeans on the Right tip, where upper and lower branches meet, and Southern and Meso-American Natives are found on the bottom left tip of the lower branch.


It is very evident by the distance between them, the vector orientation and their placement in different branches, that current Siberians and Asians are not related to modern Amerindians.


Part (c) shows a plot generated by the ADMIXTURE39 algorithm with K = 5. It shows individuals from 35 extant Eurasian and American populations which are represented by stacked columns with five ancestry proportions (y axis indicates the fraction of each of the five inferred ancestral groups).


We can see that:


  1. (Blue color). There is an important western Eurasian component admixed into Siberians, Northernmost North Americans and Greenlanders. This drops off sharply with a North to South cline for the other Amerindian populations.
  2. (Brown or Burgundy color). The Amerindian component is prevalent with a decreasing South - North Cline, among all Native American groups. And is also found in minimum fractions among Chuckchis, Tuvinians, Altai, Selkups and Kets. (We will look into this further down)
  3. (Pale Yellow). Found in minimum frequencies in Eastern Siberia, it incrases to nearly 90% among West Beringian Koryaks and Chukchis, with a strong prevalence among Arctic Americans and Na-Dene natives. It drops off with a north to south cline from around 40% in Na-Dene to a <10% fraction among Southern Amerindians.
  4. The other components are absent among South American Natives.Orange, which is prevalent among Chinese, Japanese and East Asians, drops off towards Eastern Siberia. Dark Yellow, which grows with a West to East cline and is maximum in Central and Northern Siberia.

The Amerindian signature in Asia


The "brown component" found in small frequencies in Asia is quite interesting and exactly the same pattern appears in another paper (Li et al., 208) [2]; In this case the sample includes populations from African, Southern Asian, PNG and the Middle East. Below is its Figure 1 A:


Figure 1A. From [2]

The image indicates the ancestry of different populations at K = 7 (seven inferred ancestral groups). [2]


We see that the pattern is repeated and that the Amerindian component (Violet) appears predominantly (>90%) in South America (with a slight admixture of European and even less components from other regions).


The Amerindian "violet color" reappears in East Asia among the Yakut, but with extremely small frequencies among the: Oroquen of Heilongjiang (China), the neighboring Daur of Mongolia, Hazara (Afghanistan) and Mongols. It reappears again at relatively higher frequencies among the Russians.


Why do all these Eurasian people have a tiny proportion of Amerindian in them?


Orthodox view


The accepted theory is the following:


Modern Humans reached Siberia relatively late, the rest of the Old World was already peopled. The icy Siberian regions had effectively formed a barrier to all hominins until the superior skills of modern Homo sapiens (invention of needles to sew fur clothes and the mastery of glacial-condition survival skills) breached that last barrier.


This enabled Siberians from Central Asia to trek out on a Northeastern course, reach Beringia and stay there about 5,000 years during the peak of the last Ice Age, hunting mammoths and other tundra herbivores. During this time they became quite distinct from a genetic point of view from the relatives that stayed behind in Siberia. Then during deglaciation they packed their tents and gear and rapidly marched on into the vast and empty New World occupying it in less than 2,000 years.


A second wave of migrants admixed with the first, bringing some more recent Siberian alleles which are found among Na-Dene, Innuit and other North American natives. South America remained free from this admixture.


So, any similarity between Siberians and Amerindians is due to their common ancestry. There are differences of course, but these are due to the long sojourn in Beringia which gave time for unique Native American alleles to appear and also for founder effect (only a few clans of Siberians reached Beringia, so their set of genes was rather limited) and bottleneck (some clans died out and their lineages with them, further depleting Amerindian genetic diversity) to act and further separate Americans from Asians.


By the way, these people expanded into America in small isolated groups that did not mix frequently with their neighbors, so they developed in a very short period of time, hundreds of unique languages and their genomes took disparate courses which due to drift made them appear different, but actually all sharing the same recent Asian origin.


Last of all, enslaved Africans and Europeans admixed after 1492 C.E. as a consequence of the discovery of America by Europeans so any odd European or African genes found among Amerindians (even the most isolated groups) are due to this recent admxiture.


Another unorthodox view


The model outlined above does not even consider the possibility of a pre-sapiens peopling of America. The H. habilis from Dmanisi in Georgia, the H. erectus from China or even Neanderthals and Denisovans from Altai, could have continued onwards into America, but archaic sites with Acheulean or Mousterian tools are lightly dismissed by mainstream science as geofacts or of recent manufacture.


The recency in the peopling in America is taken as a proven fact and the data are used by other branches of science (i.e. genetics) when calibrating their methods. As seen in previous posts, the late peopling of America and Siberia is accepted without questioning. This in turn implies that Old World populations have "deeper evolutionary histories", and Amerindians, in contrast are "recent".


The bottleneck and founder effects are generally assumed to have taken place prior to or during the Beringian Standstill, thus restricting the gene pool that entered America. I have not seen papers that explicitly recognize that America was peopled by a popuation with a wide spectrum of alleles and that they became extinct due to the negative impact of mass deaths caused by disease, war and over exploitation of natives after the Discovery and Conquest of America. This overlooked event was an exceptionally strong force even as recently as the late 1800s, and early 1900s.


As an example, the population of Yaghans or Yamana, canoe people living in the fjords of Southern Tierra del Fuego and the Selknam hunter gatherers of the Fuegian mainland, dropped dramatically after contact with Europeans:


The Yaghans passed from 3,000 to 100 people between 1850 and 1916; in 1995 only 75 people of admixed Yaghan origin survived. The Selknam decreased from 3,500 to 800 during the same period, today only 696 persons of mixed Selknam descent survive. Whooping cough, tuberculosis, small pox and VD wiped them out.


These were the real bottlenecks that wiped out people who had lived in isolation from Old World illnesses for milennia. But let's get back to our main subject. The alternative theory for the peopling of America.


What to Yakuts, Oroquen, Daur, Hazara, Mongols, Russians, Chuckchis, Tuvinians, Altai, Selkups and Kets have in common that allows them to have minute quantities of Amerindian ancestry?


The map I prepared (see below) shows their approximate geographic location and the figure inside each oval is the rough percentage of Amerindian ancestry in each group (it indicates the average value within each population):


map of Amerindian Ancestry in Asia
Amerindian ancestry in different Asian populations. Copyright © 2014 by Austin Whittall

We see a high frequency of Amerindian ancestry among Chukchis, Kets and Selkups. And a drop towards the south: Altai, China, Mongolia and the Hadzas. Russians: it is hard to define a location for them since we do not have the data about where the samples were taken. But the value is high and uniformly distributed among them.


I believe that there was a back-migration from America into Eastern Siberia. This accounts for the high content among Chukchis (red arrow A in map).


The dispersal advanced further into East Asia along a northern corridor since to the south mountain ranges (Cherskiy and Kolyma) along the coast blocked the way. The route then crossed the Verkhoyansk Range and reached the Lena River Basin, and, further West, the Yenisei River Basin where it admixed with the aboriginal people living there. (red arrows B in map). To the south, the Iablonovy and Stanovoy Mountains blocked their advance into Manchuria, Mongolia and China. This was the maximum advance of these "Out-Of-America" migrants. (shaded pale red in map).


Much later, the current populations of Selkups, Yakuts and Kets moved north and east into these regions and admixed with these aboriginals, incorporating the Amerindian alleles into their genome (blue arrows in map).


And then, much more recently, further mixing towards the South along the Amur and then West through Mongolia incorporated these genes into the Oroqen, Daur and Mongols. Additional dispersal towards Altai and into Russia took place along the Northernmost Silk Road (Euasian Steppe Road); similar dispersal incorporated them into the Hadza in Afghanistan. (green arrows in map).

But who are these Selkups, Yakuts and Kets?


The Turkic people


The homeland of the Turkic people and their language is in the Altai region, where proto Turkic appeared ca. 400 BC. It expanded from there: the Tuvans and Sakha (or Yakut) moving East and Northwards, and others moving west around Aral, the Caspian and into Asia Minor (finally settling in Turkey).[3]


Let's take a look at the Asians who carry these American components:


The Sakha or Yakut left their Altai homeland forced by their neighbors. They advanced along the Lena River towards the northeastern forests of Siberia. They admixed with the local natives (some of which carried the ancient Amerindian component) and also with mongol people, which have left a strong Mongol - East Asian component in them.


The Kets, also from the Altai, and also forced north due to conflict with belicose neighbors. They have a very strong Amerindian component and also, the highest frequency of Y chromosome haplogroup Q in all of Asia (93.7%), which is only found among Amerindians. Currently they are a small population (<1,500 people) yet many name places in Siberia are Ket. They are linked to the later wave that peopled America through the Na-Dene - Yeniseian languages.


The Selkups (currently about 4,300 people) have the second-highest frequency of haplogroup Q in Asia (66.4%). They were not originally from Siberia, they migrated East from the Urals and mixed with Turkic elements in the Altai area and also with the aboriginal peoples of the Yeniseian region (Siberia) who carried the Amerindian alleles. [4][5]


The Y-chromosome Q haplogroup mentioned above is very interesting and worthy of the second Part of this post.


Continues in Part 2.


Sources


[1] Morten Rasmussen et al., (2009). Ancient human genome sequence of an extinct Palaeo-Eskimo. Nature 463, 757-762 (11 February 2010) | doi :10.1038/nature08835.
[2] Li JZ, Absher DM, Tang H et al., (2008). Worldwide human relationships inferred from genome-wide patterns of variation. Science 2008; 319: 1100–1104
[3] The Turkic Languages in a Nutshell
[4] The Red Book of the Peoples of the Russian Empire
[5] Tatiana M. Karafet et al., (2002). High Levels of Y-Chromosome Differentiation among Native Siberian Populations and the Genetic Signature of a Boreal Hunter-Gatherer Way of Life. Human Biology, December 2002, v. 74, no. 6, pp. 761–789.


Patagonian Monsters - Cryptozoology, Myths & legends in Patagonia Copyright 2009-2014 by Austin Whittall © 

Tuesday, May 6, 2014

Neanderthal in America, data from an interesting genetics paper


A recent paper (G. Povysil and S. Hochreiter, 2014) [1], analyses "very short identity by descent (IBD)" genetic segments of chromosome 1, comparing those in humans, Denisovans and Neanderthals.


Their findings are contradictory and disclose some oddities among "Admixed Americans". By the way, it is a pity that they did not include real "South American Indian", South Asian and Oceanian genomes (the Puerto Rico, Colombian and Mexican populations that were included in their study are not pure Amerindian, they are a "Admixed Americans", a mixture of European, African and Native American peoples - more on this below). Nevertheless the paper is interesting and shows very close links between Africans and Americans that cannot be attributed to post-discovery mixture (slave trade) and some incongruent findings.


IBD Segments


When individuals have the same -identical- nucleotide sequences in a given segment, this segment is said to be identical by state (IBS). When these individuals inherited this segment from a common ancestor, it is said to be identical by descent (IBD). The ancestor of those individuals carried this IBD segment and passed it on to them.


How can you tell apart an IBS from an IBD? That is, two or more persons could be IBS, sharing an identical sequence yet this may have arisen purely by chance and not by inheritance, so they would not be IBD.


The authors looked for "rare variants" which as their name indicates are not very common and therefore if a rare variant is an IBS it is highly probable that it is an IBD too. Which makes sense.


They also found some IBD shared with Denisovans and Neanderthals, so these are also very ancient.


Their findings...


So what did they discover? some interesting facts, below are the highlights:

  • Denisovans and Asians. The IBD segments of Asians were the ones with the closest match to the Denisovan ones. Some segments were exclusive to Asians. They were longer than other segments shared by other populations confirming an "In Asia admixture".
  • Neanderthals and Asians. The same as with Denisovans: Asians have the highest sharing with Neanderthals and the segments are longest and many are exclusively Asian. The Europeans also share a high frequency of Neanderthal segments but... theirs are also found in other populations too.
  • Africans. Unexpectedly, they have many Neanderthal and Denisovan IBD segments, and some are exclusive to Africans. These must be ancient, and originating in the common African ancestors of H. sapiens, Neanderthals and Denisovans.

Let's dig deeper into these generalisations:


On Pearson Correlations


First, some theory. To measure the strength of a linear association between two variables, a statistical correlation is used: the "Pearson product-moment correlation coefficient" (symbolized by "r"). What it does is draw a line of best fit through the data of two variables and "r" indicates how far away from this line are these data points.


"r" can range from -1 to +1. The closer to 0, the worse the correlation, closer to 1 or -1 the better the correlation.


For negative values, the association is negative (one variable grows, the other drops), and for positive values both grow.


Below are some correlations as an example. The case where r=0, it is clear that there is no correlation between variables. (i.e. "eye color" and "criminality" would have a similar correlation: none). However "poverty" or "unemployment" and "criminality" will have 0 < r<1 (there IS a strong correlation between those variables).


Below are some examples of Pearson correlations (I prepared them with my Excel sheet):


Pearson correlation
Some examples of Pearson correlation. Copyright © 2014 by Austin Whittall

Having said this, let's see the Pearson correlation coefficient found for IBD and populations:


Denisovans


correlaton of Denisovan alleles in humans
Figure 1, Adapted from [1]. Pearson correlation between
populations and the Denisova genome

ASW: AFR Americans with African ancestry from SW US, YRI: AFR Yoruba in Ibadan, Nigeria, LWK: AFR Luhya from Webuye, Kenya, CLM AMR Colombians in Medellin, Colombia, MXL: AMR Mexicans from Los Angeles, California, PUR: AMR Puerto Ricans, CEU: EUR Utah residents with ancestry from northern and western Europe, FIN: EUR Finnish, GBR: EUR British from England and Scotland, IBS: EUR Iberians from Spain, TSI: EUR Toscani in Italy, CHB: ASN Han Chinese from Beijing, CHS: ASN Han Chinese from South, JPT: ASN Japanese from Tokyo, Japan


The figure above shows four regions with different population groups (Africa, America, Europe and Asia). The Africans show a negative correlation, Asians, Europeans and Americans a Positive one.


The correlations are not all that "strong": Asians average: 0.25, Europeans: 0.1, "Admixed Americans": 0.025 and Africans: -0.075. Which in my opinion are quite weak (very close to zero).


The Asians have the "highest correlation" to the Denisovan genome. Among Admixed Americans, the Mexicans (MXL) have a high correlation too; the authors point out that: "Mexicans (MXL) have also a surprisingly high correlation to the Denisova genome while Iberians (IBS) have a low correlation compared to other Europeans" [1]


This MXL - IBS anomaly is explained as follows: "of all European populations Iberians show the highest rates of African gene flow whereas Mexicans show a high proportion of Native American ancestry which in turn might also reflect gene flow from Asia..." [1].


Allow me to disagree (see my argument further down).


They believe their findings corroborate other studies where Denisovans share more genes with "modern East Asians and South Americans (called Admixed Americans here) than with Europeans". [1]


Now, let's see what they have to say about Neanderthals....


Neanderthals


correlation of Neanderthal genes in humans
Figure 2, Adapted from [1]. Pearson correlation between
populations and the Neanderthal genome

Again we see the same trends as with Denisovans but notice that the correlations are even stronger (the values are higher in absolute value but still ‹ 0,5). Again too, the Mexicans have a better correlation than Iberians, which is (again) lower than the rest of the Europeans.


Asians average: 0.4, Europeans: 0.2, "Admixed Americans": 0.1 and Africans: -0.15. Less weaker than the Denisovan correlations.


According to the authors, "As expected, Asians again show the highest odds for IBD segments matching the Neandertal genome... while Africans have the lowest odds .... Europeans show clearly more matching with the Neandertal genome than Admixed Americans." [1].


Why should Admixed Americans have less than Europeans? They are a mix of roughly 50/50 Europeans and Asian (via Beringia) - the touch of African (via slave-trade) is negligible as we will see further down- so Admixed Americans should have IBDs somewere in between those of Europeans and those of Asians... but they don't.


The authors [1] attribute the North-South decreasing cline in Europe (with lowest values in Italy and IBS -in Spain) to "reduced rates of shared ancestry compared to the rest of Europe... [and]... higher IBD sharing between North Africans and individuals from Southern Europe which would decrease the amount of DNA sharing with Neandertals." [1]


In other words, Africans (with less Neanderthal genes) mixed more intensely with southern Europeans thus watering down any Neanderthal IBDs in their genomes (even though Spain and Italy were peopled by Neanderthals and a place where admixture with modern humans should have taken place....


The Odd "figure 10"


hominin alleles in human populations
Figure 10, from [1]

Figure 10, shown above, perplexes me. The caption in the paper corresponding to this figure is the following (and I highlight the "baffling" text):


"Figure 10: For each genome and each IBD segment, the color indicates whether a population contains this segment (“With”) or not (“Without”). For the human genome, 4,000 random IBD segments were chosen. IBD segments that match the Neandertal or the Archaic genome are found more often in Asians and Europeans than all IBD segments (human). This effect is not as prominent for IBD segments that match the Denisova genome." [1]


In other words, they checked the "content" of specific genomes (the human one, the Neanderthal one, the Denisovan one and the Archaic one) in different populations and showed if the populations carried them or did not carry them in their current genomes.


In the text they state: "IBD segments that match the Neandertal or the Archaic genome are found more often in Asians and Europeans than all IBD segments (human genome). This effect is not as prominent for IBD segments that match the Denisova genome, but still significant." [1]


What I think they are trying to say is the following (take a look at fig. 10 above please):


Asians and Europeans have roughly 200 - 300 IBD segments that are "human", 1,500 that are Neanderthal, some 400 that are Denisovan and about 800 that are Archaic. The "old" genome (2,700 segments) is larger than the "human" one (200- 300 segments).


What they don't point out is that Americans (orange bar in fig. 10) have much higher numbers of ALL segments than Europeans or Asians, and in the case of Neanderthal IBDs, they have the highest values of all populations, including Africans. Africans also surpass both Europeans and Asians... so what is so striking about the Eurasians anyway? What is striking is the high content of "ancient" IBDs in Admixed Americans and Africans.


Could this mean for instance a very ancient peopling of America an Out of Africa directly to America (ie. H. erectus), or later, with Neanderthals, long before modern Humans reached the New World?


Americans also have a much higer "human" IBD segment content than Europeans and Asians, second only to Africans


Note that the “Archaic” element is much more significant than the Denisovan one in both Europeans and Asians... is this due to archaic genome carried by Neanderthals or the Sima de los Huesos ancestor of Denisovans? or, what about the Dmanisi in Georgia or even Homo erectus in Southern Eurasia?


Noticing the closeness between African and Admixed Americans, the authors quickly point out the "African" admixture in Americans (slave trading to the Americas after its discovery). This is, in my opinion, an incorrect assessment of the situation.


Mexican and Iberian anomalies, the correct interpretation


First of all, a "MXL" or "Mexican from Los Angeles, California" is a rather untidy way of studying traces of ancestral hominids in America... it is like looking at say, "Italians in Buenos Aires" or "Dutch in Cape Town" or even "Ashkenazi in New York", none of these groups, real and relevant as they may be, reflect the original people of those areas (Querandí, Khoi or the Lenape, respectively).


MXL, and the other "Americans" (CLM, Colombians in Medellin, Colombia and PUR Puerto Ricans) are an admixture of European, African and Amerindian. So it is difficult to come to any conclusions. Europeans, Africans and Asians on the other hand, are the "original" peoples of their respective continents and can tell us about the changes in the genomes of their respective geographic areas.


Nevertheless, we will try to work with these artificial constructs, the MXL, PUR and CLMs:


I came across a paper that takes the 1000 Genomes project data (Gravel et al., 2013) [2] and gives us a breakdown of the makeup of those "Admixed Americans" which is shown below: [2]


  • MXL. 47.6% Native American,  4.2% African, 48,2% European.
  • PUR. 12.8% Native American, 11.7% African, 75.5% European.
  • COL. 25.6% Native American,  7.5% African, 66.9% European.

Being people originating in former Spanish Colonies (Colombia, Puerto Rico and California were part of the Spanish Empire until the XIXth century), the European content is predominantly Iberian, and mostly Spanish (IBS), which may also have some ancient admixture with African individuals in their genome [3].


We must ask ourselves why the correlation with Neanderthals and Denisovans in Admixed Americans is similar to the correlation of IBS when only half their genome is Iberian? It should differ because the other half is predominantly Amerindian, allegedly closer to Asians than to Africans. Since Asians are even more correlated to Neanderthals and Denisovans we must ask ourselves how come the correlation of Admixed Americans isn't higher than the European one?


I used a rough approximation to calculate the value for the admixed Americans (very rough and I am inclined to believe that it is flawed): I calculated the weighed average by multiplying the "Pearson correlation" of each of the populations that originated the different admixed Americans by its weight in each Admixed American group, and adding them up to obtain a "calculated Pearson" for both Denisovans and Neanderthals for that group:


Example Neanderthal Pearson among MXL. See the image below (in brackets I indicate each of the populations that make up the MXL):


0,48 x 0.2 [EUR] + 0.04 x -0.15 [AFR] + 0.48 * 0.4 [NAm]= 0.28


For Nam (Native Americans or Amerindians) I took the same value as their alleged ancestors: Asians.


admixture in Americans
Calculation of Pearson correlation for Admixed Americans
Copyright © 2014 by Austin Whittall

In red, under "Average" is the value for both Neanderthal and Denisovans (0.23 and 0.129 respectively) the average is simple since the size of each American group is nearly the same (see Appendix B in [1]).


When compared with the "Actual" values given by G. Povysil and S. Hochreiter [1], we find that the Denisovan figure is very similar but the Neanderthal value is definitively off mark. Yes, I know that the calculation is rough and indeed surely wrong (see Appendix I at the bottom of this post to see why).


But I disagreed, even without any calculations, because a population that is basically a mixture of Asians (via Beringia) and Europeans must have a Pearson correlation somewhere between the values of both of those two populations. But, the value given by Povysil and Hochreiter is ten times lower! and almost zero (no-correlation)


Furthermore, the data in figure 10 clearly shows that Americans have the highest Neanderthal IBS of all groups.


There is something that is not quite right in this paper or I have not understood the data.


Additionally, Table 1 in [1] shows how IBDs are shared between populations. And it has some striking values:


Key: AFR = African, AMR = Admixed Americans, EUR = Europeans, ASN = Asian.


  • AFR / AMR = 28,710
  • AFR / ASN = 387
  • AFR / EUR = 986
  • AMR / ASN= 207
  • AMR / EUR =1,008
  • ASN / EUR = 351

Once again, as with Fig. 10, Africans and Americans are close together: Africans and Americans share nearly 29,000 IBS despite AFR being only 4 -12% of AMR ancestry, while Europeans (48 - 76% of AMR ancestry) only share 1,008 IBD with Americans, and Asians, share even less IBD (207) than EUR.


Africans share 74 times more IBS with Americans than with Asians and 29 times more than with Europeans. Why? Slave trade cannot explain this. Maybe an ancestral admixing (H. erectus or even earlier... Dmanisi?)


In Appendix A [1] , they also indicate the "rare and low-frequency variants .... (0.5 - 5% frequency)", found in different quantities in each population. As expected (by me) Africans and Americans have the highest values:


  • AFR: 558,996 - 683,289
  • EUR: 143,987 - 155,270
  • ASN: 118,137 - 120,115
  • AMR: 163,737 - 214,430

The authors note that Africans have 4 times more rare alleles than all other populations and add, trying to attribute America's high values to admixed African genes, they state (bold mine): "if we ignore the Admixed Americans that have African admixture".


But this statment is off mark: we have seen that Admixed Americans only have 4 - 12% African genetic content!, how can they have such a high frequency of rare alleles? They have +28% more than Europeans and +60% more than Asians! These are supposedly "rare" and "ancient" markers, shouldn't they appear more frequently in the Old World?


I even suspect that the massive loss of lineages in America post-discovery due to disease and war during the XVI century, wiped out many rare lineages and what we see is the tip of a once vast iceberg. The ghost of the ancient peopling of America.


It is a shame that the paper did not include "real" Amerindian and Papuan / Oceanian samples. Maybe future studies will do so. It is also a pity that when faced with a brink, they back off and stick to orthodoxy.


Appendix I


Why my "rough calculation" was flawed:


Actually Admixed Americans are a mixture of "certain" members of three different populations, whose admixture can range from 0 to 100% and include any of, or all of, these populations. That is, for example: "pure" american natives with no European or African ancestry on one hand and, mixed descendants of Europeans and Africans and American Natives on the other.


So the calculation is not a simple mathematical average. The resulting distribution depends on which members of the orignal populations take part in the final admixture. Because the individuals of each population carry different frequency of Neanderthal or Denisovan alleles in their genomes which may be different to that of the whole group.


Just as an example I made a simulation with three populations (American, African and European), each with a distribution that gave a Pearson correlation (r) identical to those reported by Povysil & Hochreiter [1] for Neanderthals, the outcome is shown below:

Pearson correlation simulation
A simulation of Correlations by admixing populations, for Neanderthals and MXL
Copyright © 2014 by Austin Whittall

On the left side I placed three clusters: the Europeans are shown with blue rhombus, their trend is the blue line with r=0.2; the Africans are the red squares and the red line marks their r=-0.15, finally American Natives are the green triangles with a green line marking r=0,4 (For them I adopted the Asian values).


Note the dispersal of the dots (a cloud of dots with no real pattern), this shows how "slack" correlations are when they are far from 1 and close to 0.


On the right side is a mixture, which takes the Mexican "combination" of 48% European, 4% African and 48% Amerindian. So if there were 16 values in each population, the mix was made up of 8 chosen from Europeans, 8 from Amerindians and 1 from Africans. These points were taken from the original distributions shown on the Left, and the outcome is shown with the red circles and the red line. I chose any points, at random.


The Pearson correlation value in the chart, for the mixed population, was r=0,11. But in other simulations, depending on the points chosen from each population, I obtained different correlations which varied widely, from r= -0,08 to r= +0,83.


This proves that my assumption was flawed. Nevertheless, the populations used by [1] consisted of more than 16 values or points, they had over 350 individuals in each population. So the dispersion "cloud" would not be similar to mine and it is likely that the final values of "r" would not be so different.


Sources


[1] Gundula Povysil, Sepp Hochreiter, (2014). Sharing of Very Short IBD Segments between Humans, Neandertals, and Denisovans. bioRxiv April 7, 2014. doi: 10.1101/003988
[2] Simon Gravel et al., (2013) Reconstructing Native American Migrations from Whole-Genome and Whole-Exome Data. PLoS Genet. Dec 2013; 9(12): e1004023. doi: 10.1371/journal.pgen.1004023
[3] Johnson NA, et al., (2011). Ancestral Components of Admixed Genomes in a Mexican Cohort. PLoS Genet 7(12): e1002410. doi:10.1371/journal.pgen.1002410


Patagonian Monsters - Cryptozoology, Myths & legends in Patagonia Copyright 2009-2014 by Austin Whittall © 

Tuesday, September 27, 2011

Denisovans and America

 
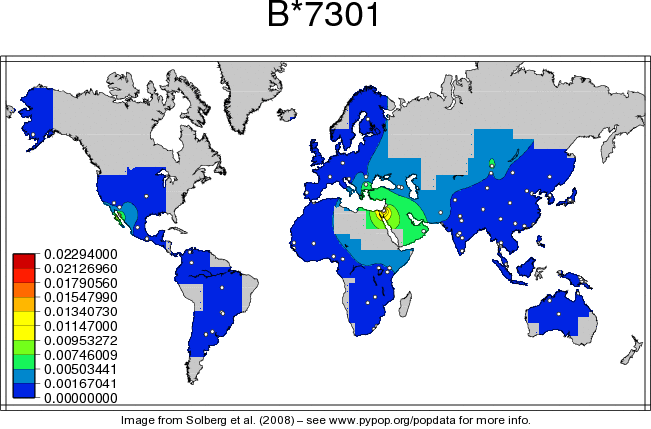
My previous post (first Asians were not erectus) concluded with a reference to a paper on Denisovans which stated that: “ modern humans acquired the HLA-B*73 allele in west Asia through admixture with archaic humans called Denisovan” [1].
Lets dig a little deeper into this HLA allele.

A very uncommon HLA allele

Among all the HLA-B groups (which add up to thirty six ( 36 varieties): B*07, B*08, B*13.... B*83) it is the one with the least quantity of specific HLA halotypes. In other words each of these thirty six groups have their own variations. For instance HLA-B*07 has 124 different allotypes, HLA-B*15 has 221 allotypes.

The one that we are interested in, HLA-B*73 has only two: B*73:01 and B*73:02 (which was detected in only one person in Abi-Rached’s study, so we can set it aside).

Globally its frequency within the human population is quite low, less than 1%, and in most of the world it is closer to zero. But, some places show a very high frequency in comparison to others.

The “raw” data is shown in the following table which combines data from [1] and [3]:

Frequency / Place – ethnic group
(Data from [1] unless indicated otherwise. )
4.90% Parsi
2.30% Israel Jews
2.00% United Arab Emirates
1.10% Cameroon Beti
0.90% Georgia Tiblisi,
0.90% Bulgaria
0.90% Morocco Casablanca
0.90% Burkina Faso Mossi
0.80% Russia Tuva,
0.80% Oman
0.70% Average for SW Asia [3]
0.60% Albania
0.60% Cameroon Bamileke
0.50% Mongolia Khalkha
0.50% Pakistan Pathan
0.50% Iran Baloch
0.50% Tanzanaia Dodoma Kongwa
0.50% Israel Druze
0.50% Algeria
0.40% Average for NE Asia [3]
0.40% Saudi Arabia
0.40% Turkey
0.30% Bangladesh Dhaka Bangalee
0.30% Jordan Amman
0.30% Uganda Kampala
0.20% Kenya Nandi
0.20% Kenya Luo
0.20% Zimbabwe Harare Shona
0.20% Rwanda
0.20% Greece
0.20% Macedonia
0.20% North America, Hispanic [3]
0.10% Europe [3]
0.15% Mexico Sonora, Seri [3]

Comments.

  • We see that it is strongly concentrated in the Middle East and SW Asia, across central and northern Africa and in the Balkans and Caucasus (home of the Dmansi people).
  • There are some local “islands” or “singularities”:

    • in Mexico (the Seri natives). We will look into them later.
    • in Mongolia (close to the Denisovans?)
    • in the Russian republic of Tuva (right next to Altai, homeland of the Denisovans)
  • The highest frequency is in Pakistan (more later)
  • The Israeli Jews and Druze together are second highest.

Some maps

I love maps! As they show things more clearly than a table. Fortunately, all this data was placed in a map by Abi-Rached [1]. In which he shows the Current distributionA”. Then, trying to explain the anomalously high Pakistan figure, he defines two models which take into account that the Parsi population now living in Pakistan came from Persia, escaping religious persecution. Figure “B” shows one of these models (they are both very similar) which considers the city of Nishapur as the refugee of the persecuted Zoroastrians. There is yet a third map, “C” which shows the global distribution of the HLA-B*73:01 allele, now including Australia and America, as it comes from another source [2] it differs slightly from the data given by [1]. Nevertheless, Maps “A” and “C” are very similar and show the same trend.

HLA-B*73 frequencies
Map showing the global distribution and
frequencies of HLA-B*73:01 (adapted from [1] and [2]
.

Remarks

The maps clearly show some “hot spots” in Mongolia and the Altai Region and an anomaly in Western Mexico (the Seri natives land).

Could the swath across Africa be related to Arab slave trade and possible mixing with locals? Or is it more ancient and shows a returning flow of humans into Africa after acquiring the HLA-B*73 from the Denisovans.

The Balkans, may be due to the Turkish occupation of that area between the 14th and the 19th century.

We see tha China, SE Asia, Australia, Southern Africa and Mots of America and Europe have less than 0.5% frequencies.

So, what does all this mean?

If, as Abi-Rached contends, modern humans picked up the HLA-B*73 allele from Denisovans, they must have “trekked” through Denisovan terrritory. Perhaps the areas where the HLA-B*73 frequency is highest corresponds with the Denisovan homeland: because the humans who settled in the Denisovan territory would have had more time /chances to “mix” with them and breed future generations carrying Denisovan HLA alleles. And from there they would have dispersed to other locations taking the HLA alleles with them.

So, if the maps are correct, Iran is the homeland of the Denisovans. Pakistan’s high figures are just a coincidence, because it is there where the Persian Parsis moved to save their lives.

The Druze and Israeli Jews are also another hot-spot which we will look into later (they are linked to other genetic evidence) , but the high frequency in this region may have two possible explanations:

  • It probably indicates that Denisovans were living in that area along the Jordan River valley
  • Perhaps it reflects the comings and goings of the Jewish people (remember that they were held captive in Babylon (Babylonian exile) after Nebuchadnezzar forced them in o exile after conquering the kingdom of Judah ca. 590 BC. They probably picked up the “Persian” HLA-B*73 during their captivity there, Persia is right next to Israel. Furthermore, after the creation of the state of Israel, many Jews living in Iraq and Iran were forced to move out and migrate to Israel.

Map “C” clearly shows the hot spot centered in the Middle East and fanning out north west into the area where “late” Denisovan remains were later found (Altai). Suggesting perhaps that the Denisovans occupied this area and later were forced to less favorable lands such as Altai and Southern Central Siberia / Mongolia.

Coincidentally this region (Levant, Caucasus and Altai / South Central Siberia) is where Neanderthal remains have also been found. This may just indicate that it was an area where the last remnants of dwindling homind populations found refuge (i.e. Neanderthals and Denisovans).

Denisovans

Since those (H. heidelbergensi?) who would later become Neanderthals and modern humans split from the Denisovans about 1 million years ago, and Denisovans survived until about 30-50 kya, we can imagine that they lived for 1 million years in this same territory. Let’s put this in context and link it to our previous post.

We had said that about 2 million years ago, H. habilis left Africa, settled in the Caucasus and there evolved (1.75 M years ago) into the Dmanisi people Homo georgicus. These in turn led to H. erectus (which peopled Southeastern Asia and China, moved back to Africa and into Europe). The Dmanisi may have also moved on into America and into Flores Island, where they became the local Hobbits.

All of this happened before 1.5 million years ago. Then there is a blank space of half a million years. The next solid evidence is that 1 million years ago, the Denisovans split from the branch that led to modern humans and Neanderthals: the H. heidelbergensis.

What happened in the Dmanisi homeland during the period 1.5 to 1.0 million years ago? Had all the Dmanisi disappeared, becoming H. erectus and migrating to East Asia, Africa (or America)? Did any remain behind, to become the ancestors of both H. heidelbergensis and the Denisovans? Did they die out?

I have not read about any H. erectus fossils being found in South Western Asia, so if the Dmanisi stayed there, and did not become extinct, they had to become something else.

Getting back to Africa, H. ergaster is said to be the ancestor of H. heidelbergensis and of modern humans, so it is them, the H. ergaster who is the most likely common ancestor of Denisovans and the rest of mankind. And, on the “human - Neanderthal” branch, immediately after the Denisovan split, we can fit H. heidelbergensis, see below (it is a revised version of the tree published in yesterday's post):

phylogenetic tree
Revised phylogenetic tree.

This does not tell us anything about the fate of the Dmanisi though. It says that Denisovans split before the appearance of H.heidelbergensis, and marched out of Africa towards the Middle East, settling in South Western Asia where, they would later mix with modern humans and maybe, Neanderthals.

The Seri natives in Mexico

The the Seri language is a linguistic isolate which has no apparent connection with any language in the United States or Mexico. They are only about six hundred Seri left, and a Genetic study [4] seem to link them to the Warao Indians of Venezuela and suggest that the Seri’s ancestors were part of a first wave of migrants into America.[5]

The paper [4] however does not mention HLA-B*73.

There is however more data in Abi-Rached’s paper:

Worldwide, ~98% of people carrying B*73 also carry C*15:05[1]

This C*15:05 (also known as Cw*15:05) as seen in the following maps, is also present in Mexico – see red arrow, as well as all the other Asian regions that have a high frequency of B*73. The maps are from [1] above and [2] bottom and show the same distribution (with the exception of SE Asia, where there is a spot with very high frequency of C*15:05 in Indochina which is not shown in the bottom map.

We have to understand why the Seri have such a high frequency of B*73 and Mexicans of C*15:05 in comparison to the rest of the American Indians.

That will be the subject of a future post.

Map showing the global distribution and
frequencies of HLA-C*15:05 (adapted from [1] and [2]
.

Sources

[1] Abi-Rached, et al. (2011). The Shaping of Modern Human Immune Systems by Multiregional Admixture with Archaic Humans Science 25 August 2011: 1209202DOI:10.1126/science.1209202
[2] Map showing B*7301 dispersion is from This page: Allele frequency net: a database and online repository for immune gene frequencies in worldwide populations. From: Gonzalez-Galarza FF, Christmas S, Middleton D and Jones AR Nucleic Acid Research 2011, 39, D913-D919 and based on Solberg et al (2008) the original is at: http://www.pypop.org/popdata/2008/maps/B-7301.gif
[3] dbMHC Home, NCBI
[4] Infante, E., A. Olivo, C. Alaez, F. Williams, D. Middleton, G. de la Rosa, M. J. Pujol, C. Duran, J. L. Navarro, and C. Gorodezky. ( 1999). Molecular analysis of HLA Class I alleles in the Mexican Seri Indians: Implications for their origin. Tissue Antigens 54:35-42.
[5] Jim Hill, David Yetman, A world revealed by language: a new Seri dictionary and unapologetic speculations on Seri Indian deep history


Patagonian Monsters - Cryptozoology, Myths & legends in Patagonia
2011 International Year of Forests
2011 International Year of Forests Copyright 2009-2011 by Austin Whittall © 
Monday, September 19, 2011

More on Neanderthal in America

 
Continuing with the "American Neanderthals"... I took another look at the map showing the B006 haplotype in the X chromosome which I had posted in my previous entry, and was surprised to notice that there is a high "density" of this mutation in the Indian Subcontinent.
So I focused on the regions with high concentration of this haplotype and marked them on the map, which you can see below:

B006 mutation
Worldwide distribution of B006 haplotype based on a worldwide sample of 6092 X chromosomes. Areas with high percentage are highlighted . From [1]

As you can see, there are three areas within America that have a high density of B006 mutation:

1. Amazon: northern Bolivia, south western Peru and western Brazil. A relatively out of the way place, which due to its isolation could account for a high ratio of a rare mutation.
2. Meso America and northwestern South America, from Colombia to Yucatan.
3. Western Canada and the US (British Columbia, Oregon, Washington and California. (The "odd" Yuki live in California).
4. Europe excluding the Balkans and Southern Italy.
5. Indian Subcontinent.

The Indian Subcontinent's oddity

Why India and Pakistan? The map shows that the percentage of humans with B006 mutation drops off as you move out of Europe into Asia and across Asia (in China it drops to 0% of the population).

It picks up in Beringia and increases dramatically in America.
But, why so high in the Indian Subcontinent (yes, I also saw the Australian increase after dropping off to zero in Indonesia. What can that mean? Perhaps the "Kow Swamp" people took it there: they were robust hominids which survived until about 10,000 years ago in Australia, co-existing with modern humans).

Getting back to India and Pakistan. I recalled that I had posted about another mutation in the X chromosome known as RRM2P4.

It is rare in Africa and so it is probably of non-African origin or, belongs to some group that moved out of Africa with it (where it later disappeared) and passed it back into the modern human lineage (this is known as "introgression"),
So I decided to take a look at the data on RRM2P4, and came across a Table from [2] shown below:

RRM2P4 data
Table 1. Shows RRM2P4 sequence in different populations. From [2]

I was expecting American sequences to resemble Western Asian ones (after all that is where the Amerindians are supposed to have come from), but no. No similarity whatsoever.

The only Asian sequence that is identical to American ones, is from Pakistan.

So here we have a link between: Pakistan and America with an X chromosome mutation RRM2P4 and the previous one, another mutation in the X chromosome (B006) linking America and the same region of the Indian Subcontinent.
Two links that completely by-pass the rest of Asia that lies between Pakistan/India and America.

Both in an X chromosome, one which we all inherit from our female ancestors (if you are a man, your X chromosome is your mother's and your Y is your father's. If you are a woman, you got an X from your mom and another X from your Dad, but his came from his mom - your paternal grandmother).

So this means that these mutations introgressed into the human (H. sapiens) lineage from Female H. erectus or Neanderthals.

But is there any other linkage between both regions?

O blood allele, as I mentioned in my previous post has been linked to Neanderthals and, has its highest frequencies in America. Most of Western Asia has relatively low ratios of O allele, and B is predominant (you would expect the opposite if Asia was the cradle of Amerindians).

But, surprisingly, a study indicates that O blood group is higher in Sindh and Baluchistan (Southern Pakistan), see table below from [3]:

blood groups pakistan

And the data from [4] indicates that in eastern Pakistan, just above Sindh the percentage of O allele is even higher, as it ranges from 54& to 57.6% (Punjab, Gujrat and Wah Cant).

In India, the area just east of those mentioned in Pakistan, have a very strange blood group, the "O Bombay Blood Group", first discovered there, and found in about 1 every 17,600 persons in India.

It is found on the western coast of India and in Maharashtra, Gujrat (India) Karnataka, Goa and Andhra Pradesh.

So we have a higher percentage of O allele in this part of the world, and, a strange variety found only here!.

Sources:

[1] Yotova et al., (2011). An X-linked haplotype of Neandertal origin is present among all non-African populations 25.01.11.
[2] Michael F. Hammer, Daniel Garrigan, Elizabeth Wood, Jason A. Wilder, Zahra Mobasher, Abigail Bigham, James G. Krenz and Michael W. Nachman, (2004), Heterogeneous Patterns of Variation Among Multiple Human X-Linked Loci, The Possible Role of Diversity-Reducing Selection in Non-Africans.
doi: 10.1534/genetics.103.025361 Genetics August 1, 2004 vol. 167 no. 4 1841-1853
[3] Imranud Din Khattak, Taj Muhammad Khan, Purdil Khan, Syed Mukhtar Ali Shah, Sania Tanveer Khattak, Anwar Ali. (2008). J Ayub Med Coll Abbottabad 2008;20(4). Frequency of ABO and Rhesus blood groups om district Swat, Pakistan
[4] Mohammad Anees and Mohammad Shabir Mirza, (2005). Distribution of ABO and RH Blood Group Alleles in Gujrat Region of Punjab, Pakistan Proc. Pakistan AcaMd.. SAcnie.e s4 2&(4 M):.2 3S3ha-2b3ir8 M.2i0rz0a5


Patagonian Monsters - Cryptozoology, Myths & legends in Patagonia
2011 International Year of Forests
2011 International Year of Forests Copyright 2009-2011 by Austin Whittall © 
Hits since Sept. 2009:
Copyright © 2009-2025 by Austin Victor Whittall.
Todos los derechos reservados por Austin Whittall para esta edición en idioma español y / o inglés. No se permite la reproducción parcial o total, el almacenamiento, el alquiler, la transmisión o la transformación de este libro, en cualquier forma o por cualquier medio, sea electrónico o mecánico, mediante fotocopias, digitalización u otros métodos, sin el permiso previo y escrito del autor, excepto por un periodista, quien puede tomar cortos pasajes para ser usados en un comentario sobre esta obra para ser publicado en una revista o periódico. Su infracción está penada por las leyes 11.723 y 25.446.

All rights reserved. No part of this publication may be reproduced, stored in a retrieval system, or transmitted in any form or by any means - electronic, mechanical, photocopy, recording, or any other - except for brief quotations in printed reviews, without prior written permission from the author, except for the inclusion of brief quotations in a review.

Please read our Terms and Conditions and Privacy Policy before accessing this blog.

Terms & Conditions | Privacy Policy

Patagonian Monsters - https://patagoniamonsters.blogspot.com/